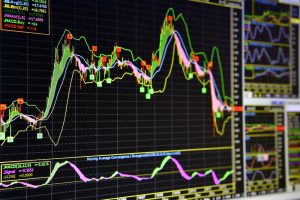
 As a trader, success comes from understanding tools such as charts, planning well, having an arsenal of trading strategies, and using indicators. While indicators won’t necessarily lead you to make profits or bigger or more frequent gains, they certainly help by giving you good clues as to how to proceed. Technical indicators are based on mathematical formulae that help reveal patterns that may otherwise be hidden, spark a trading idea, and generally save you time so you are available to study the market more thoroughly. Let’s look at two of the three most-used technical indicators.
Moving average
This reveals a trend and helps you follow it. It also shows you the average price over a period of time. The moving average (MA) is a line that helps you smooth out the up-and-down price fluctuations so that you’re able to follow the main trend without distractions like corrections. An MA tells you what the direction of a market is at any given point in time, but it doesn’t predict a price in the future.
The advantages of the MA are that you’ll spot trends and reversals, and you’ll be able to see support and resistance levels. However, you must also note the downside: it lags behind the current price. In other words, it will change less frequently than the price chart because the indicator is based on the past prices.
There are four MAs, each with a slightly technical difference:
The most popular periods for MA are 200, 100, 50 and 20, with the 200-period helping you analyze long-term historical trends, and the 20-period helping you follow a short-term trend.
You will see a bullish trend when a currency pair’s price is above the MA; it is bearish when this price falls below it. When a short-term MA rises above a long-term MA, the trend is going upward; it’s headed downward when a short-term MA dips below a long-term MA.
Bollinger bands
These help you measure market volatility. As with MAs, they help you measure a trend’s direction with trend tracking. Bollinger bands are made up of three lines or bands. Each band is an MA, with the middle one being a 20-period simple MA in most cases. The middle band is usually a 20-period SMA. The upper and lower bands are the volatility bands. They are moved two standard deviations higher than and below the middle band.
The Bollinger bands indicator places the price in parameters between the two outer bands. The price revolves around the middle band. It can certainly flirt with levels beyond the outer bands, but only for short periods before coming back.
Sometimes the bands are closer. At other times, they are further apart. When they are close, the market is smoot; the market is volatile when they are far apart.
Bollinger bands are useful as a vessel for forex advice because it is great when a forex pair is trading within range. When this is the case, the bands can be used as support and resistance levels for you to open your position. When a trend is strong, the price can spend a long time at one Bollinger line without moving to the opposite one. Consequently, it’s best to steer clear of Bollinger in moving markets.
The closer the price gets to the upper band, the more overbought the currency pair becomes. In terms of CFD trading tips, for example, the buyers have already taken profits on the advance of the price and close their trade to take profit. The overbought pair will stop rising and turn down. The price’s movement above the upper band may be a sign to sell, while a dip below the lower band could signal buying.
Technical indicators alone shouldn’t inform your decisions, and you should not go on the strength or clarity of just one. It is far better to use at least two, such as the Bollinger and the Moving Averarage.