Bitcoin analysts have been changing their tunes of late, shifting from pessimistic prognostications of doom to the possibility that cryptos might continue the positive run they have established in 2019. If forming higher highs and higher lows over time is the true definition of a positive trend, then “make the trend your friend” is always the best strategy to follow, but do these aphorisms apply to the strange and mysterious asset class of digital currencies?
Technical analysis (TA) has always been the best tool in the trader’s toolbox for assessing market sentiment and psychology in traditional, well-established financial trading markets, especially foreign exchange markets where trading the currencies of the world lead all markets in daily turnover. Cryptos, however, are still in their infancy and are traded on a mixed bag of a disjointed, under or unregulated at best, network of global exchanges, some favoring “bot” trading and many accused of inflating volumes for competitive reasons. Applying TA to this data can be suspect, to say the least.

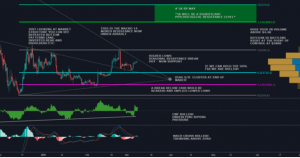
But these misgivings have not deterred a broad cadre of highly skilled analysts to put their reputations on the line and publish forecasts, based on their latest renditions of the craft. The chart above is just one of many that have appeared online, each prepared by an analyst that has built an enormous following on the Internet. This analyst’s take is in “Green” at the top of the chart: “5K by May – 5K will be a significant psychological resistance level.”
The prediction is based on recent price behavior of Bitcoin for the year. Various diagonals of support and resistance, the “dotted lines”, have been added to suggest that a major decision point is imminent out in April. The “falling wedge” pattern, by traditional interpretation, means that buyers and sellers are in deliberation over what direction a breakout must soon take in the future. The positive step-wise fashion in February and now March would point north, if TA is to be believed.
This experienced trader and cryptoanalyst goes by the Twitter name, for whatever reason, of “fil-fil” (emojis omitted), but many investors and traders have grown to trust his judgment in the past. He contends that Bitcoin is very bullish at the moment, maintaining its support for the year, while ranging within tight boundaries with low volatility, a strange set of events that has had the analyst community in a quandary, after many had said for months that doom below $2,000 was in the cards.
Other analysts take a longer-term view, claiming that the run-up could occur during the balance of the year, followed by a pullback and then a great charge northwards in 2020, as positive results on the institutional front take root and transform the industry. Of course, these fellows never forget to mention that, if prices dip below $3,400 and Bitcoin “whales” do not come to the rescue, then all bets are off.
So whom do you believe at this point? Technical analyses should never be taken as gospel. Even in established financial markets with long histories of investor data, TA at best only suggests probabilities. Pattern recognition, lines of resistance and support, and Fibonacci ratios appear because traders and “bots” base many of their judgments upon them. Fundamental forces, however, are what drive potential price behavior in a market, and many of these events can come as total surprises, wreaking havoc in the form of wide market swings until a new equilibrium is established.
Be cautious, curb you greed, and avoid herd mentality, but have fun in the process.